Data from regional climate modelling
High-resolution, gridded atmospheric data with 15 and 5 km resolution are provided by the University of Trier. The data can be regarded as downscaled reanalyses. The data cover the whole region of the Weddell Sea (including the Antarctic Peninsula and King-George Island) and are provided in NETCDF format for the period 2002-2017. The data may be used for many SPP projects, which want to use the data directly for the forcing of models such as sea-ice ocean models, glacier models and ecosystem modelling. The data can also be used for climatological studies of specific regions. Some projects have short-term measurements and would like to put their data into a larger context (spatially and temporal) with the aid of the model data. The data include the whole atmosphere from the surface to the lower stratosphere, but for most users the near-surface variables might be of largest interest, which are e.g. temperature, humidity, precipitation, radiation, heat fluxes, wind speed and cloud cover.
University of Trier, CCLM simulations Weddell Sea (SPP project HE 2740/19)
Model : CCLM 5.0
Sea ice Data: AMSR-E
Sea-Ice Temporal-Resolution: Daily
Forcing Data: ERA-Interim 6 h
Daily Reinitialized simulation with 6 hour spin-up time
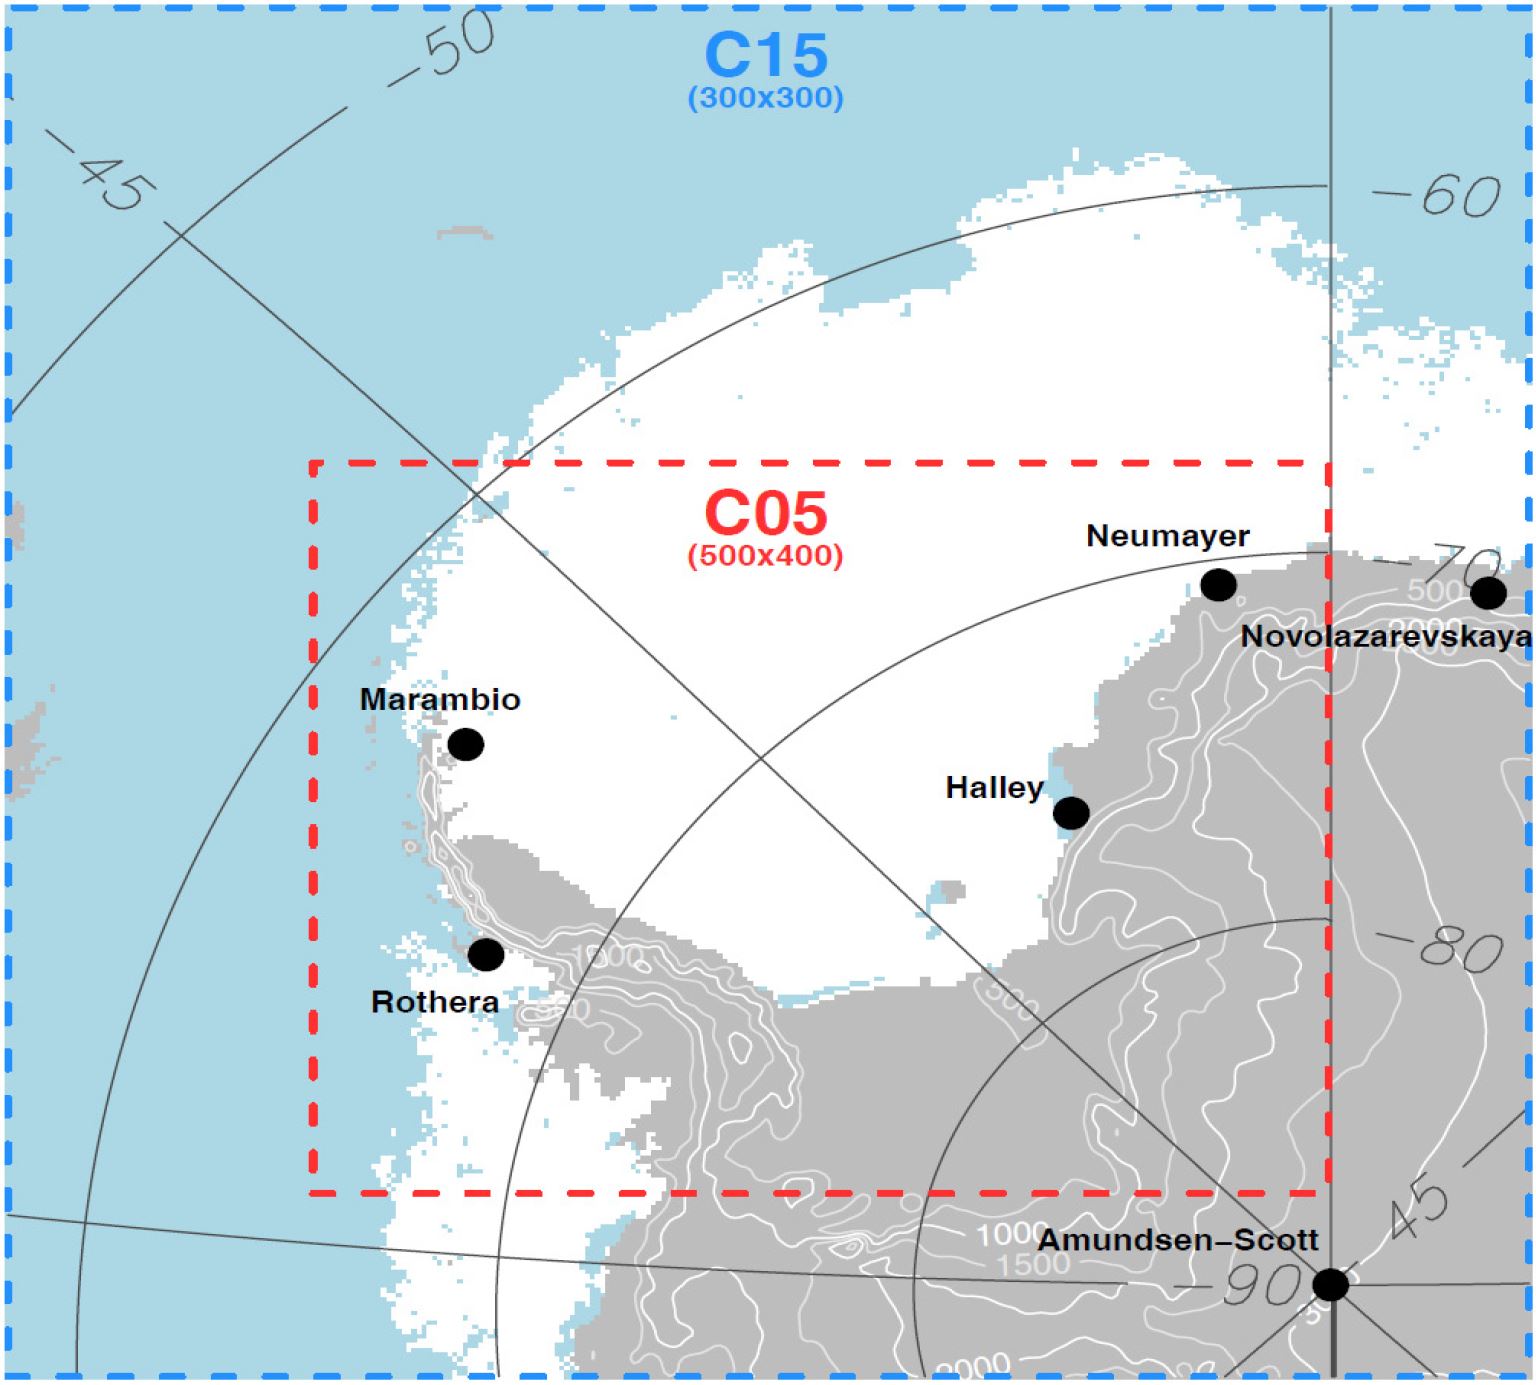
Runs (see Figure):
15 km resolution (C15) for Antarctic continent and Weddell Sea
5 km resolution (C05) for Weddell Sea
Lowest atmospheric level: 10 m
Highest atmospheric level: 25 km
Number of vertical levels in the atmosphere: 60
Available periods:
2002 – 2017 (15 km resolution)
2002 – 2016 (April-Sep. 5 km resolution)
Temporal resolution : 1 h
Data format: NETCDF
Contact: Günther Heinemann, heinemann(at)uni-trier.de
Hourly near-surface variables (selection)
| 2 m air temperature | Surface temperature | |||
| Precipitation | Snowfall | |||
| Surface pressure | Sea level pressure | |||
| 2 m specific humidity | 2 m relative humidity | 2 m dew point temperature | ||
| Duration of sunshine | Net shortwave radiation | Direct downward shortwave radiation | Diffuse downward shortwave radiation | Diffuse upward shortwave radiation |
| Downwelling longwave radiation | Upwelling longwave radiation | |||
| Sensible heat flux | Latent heat flux | Evaporation | ||
| 10 m wind speed | Eastward 10 m wind | Northward 10 m wind | ||
| Height of the atmospheric boundary layer | ||||
| Water vapor path (precipitable water) | Vertical integrated cloud ice & vertrical integrated cloud water | Total graupel content vertically integrated | Total rain water content vertically integrated | Total snow content vertically integrated |
| Total cloud cover | Low cloud cover | High cloud cover | Medium cloud cover | |
Hourly 3D variables at 60 levels (selection)
| U-component of wind | V-component of wind | Wind speed |
| Vertical wind velocity | ||
| Air temperature | ||
| Specific humidity | ||
| Specific cloud liquid water content | ||
| Specific snow content | ||
| Specific graupel content | ||
| Specific rain content | ||
| Specific cloud ice content |
